 |
Version 11.0.0
|
|
Version 11.0.0
|
FlameGraphs, invented by Brendan Gregg, help visually summarize on-CPU call stacks.
Below is an image of a FlameGraph generated from a 10-second run of the evict-btree-stress-multi wtperf job:
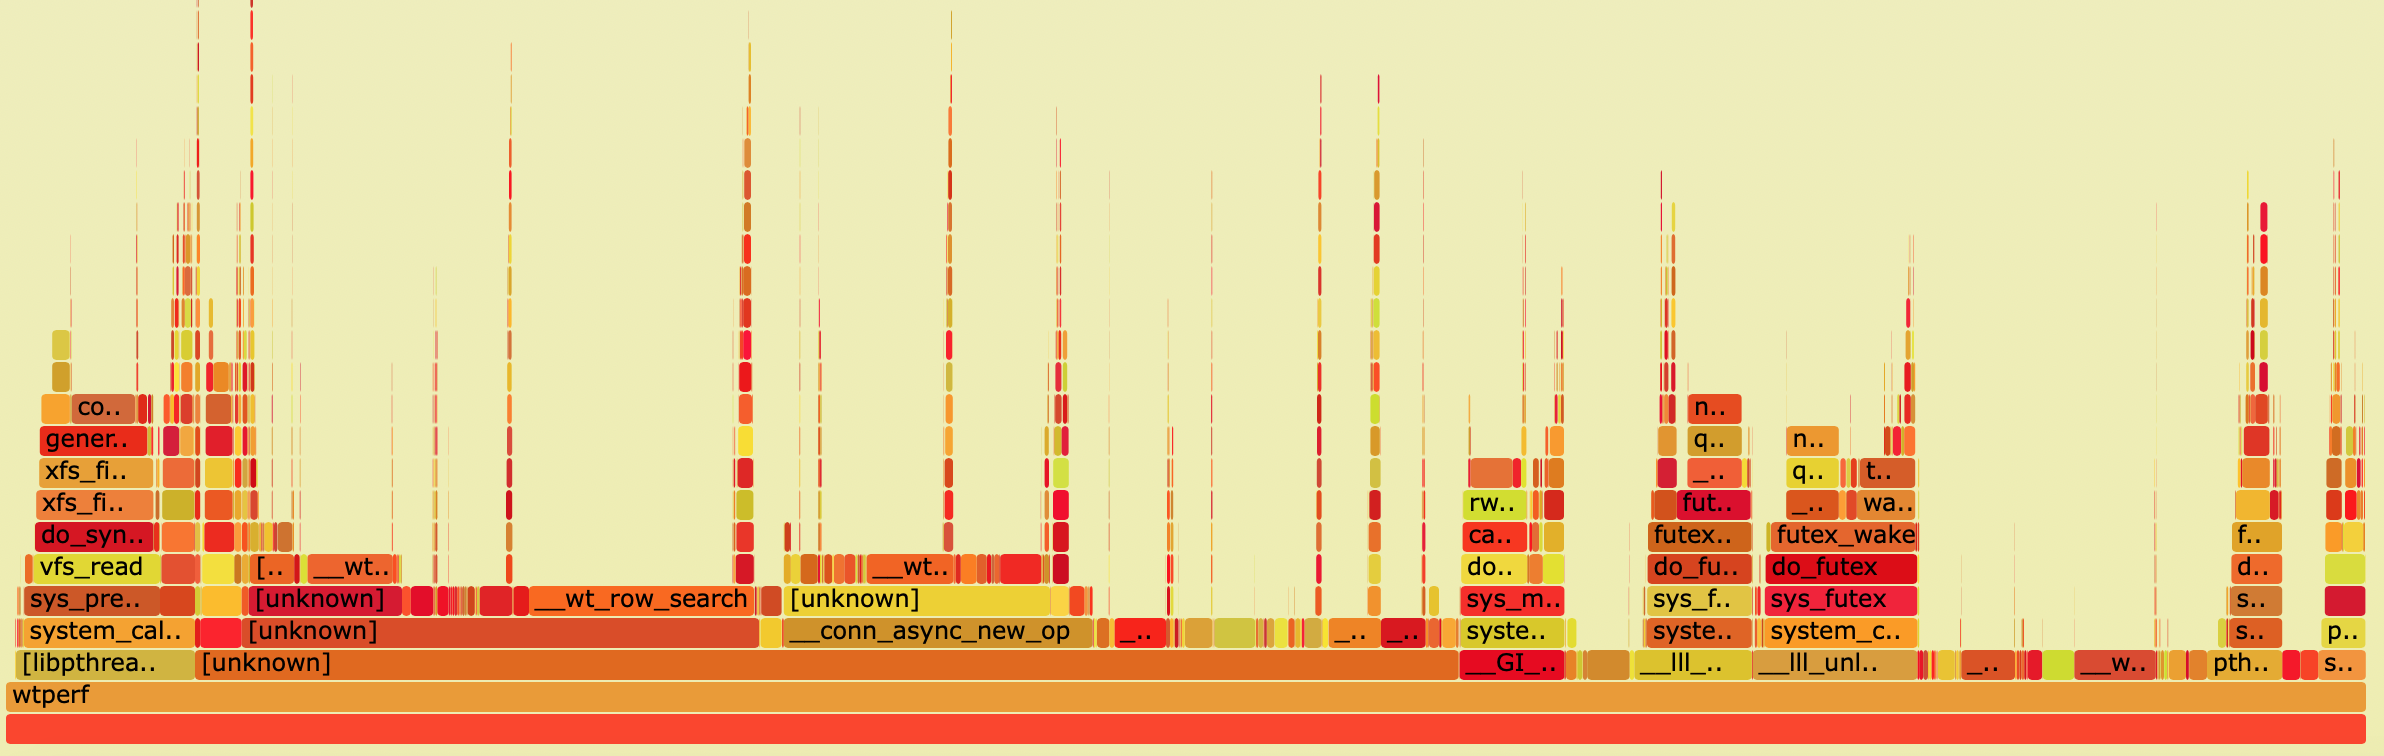
To see it in action, download the non-redacted interactive version here and open it in your web browser.
Quoting from Brendan Gregg's website, here is how to interpret the output of the FlameGraph:
Note: If you generate a FlameGraph yourself and then open it in a browser, the image will be interactive, allowing you to hover over the functions to see their full names.
To generate FlameGraphs, you first need to run perf and generate a perf.data file using the perf record -g command. Click here for instructions explaining how to do this with WiredTiger. Don't forget the -g option: you need it in order to record the call stacks!
# Clone the FlameGraph repository
git clone https://github.com/brendangregg/FlameGraph
cd FlameGraph

# Place perf.data into the current directory, then run these commands.
# Run them on the same machine where you ran `perf record` so perf can
# resolve the symbols.
perf script | ./stackcollapse-perf.pl > out.perf-folded
./flamegraph.pl out.perf-folded > perf-kernel.svg
Then open the resultant svg file in your web browser.
Here is another FlameGraph for a full run of the many-stable-stress.wtperf job:
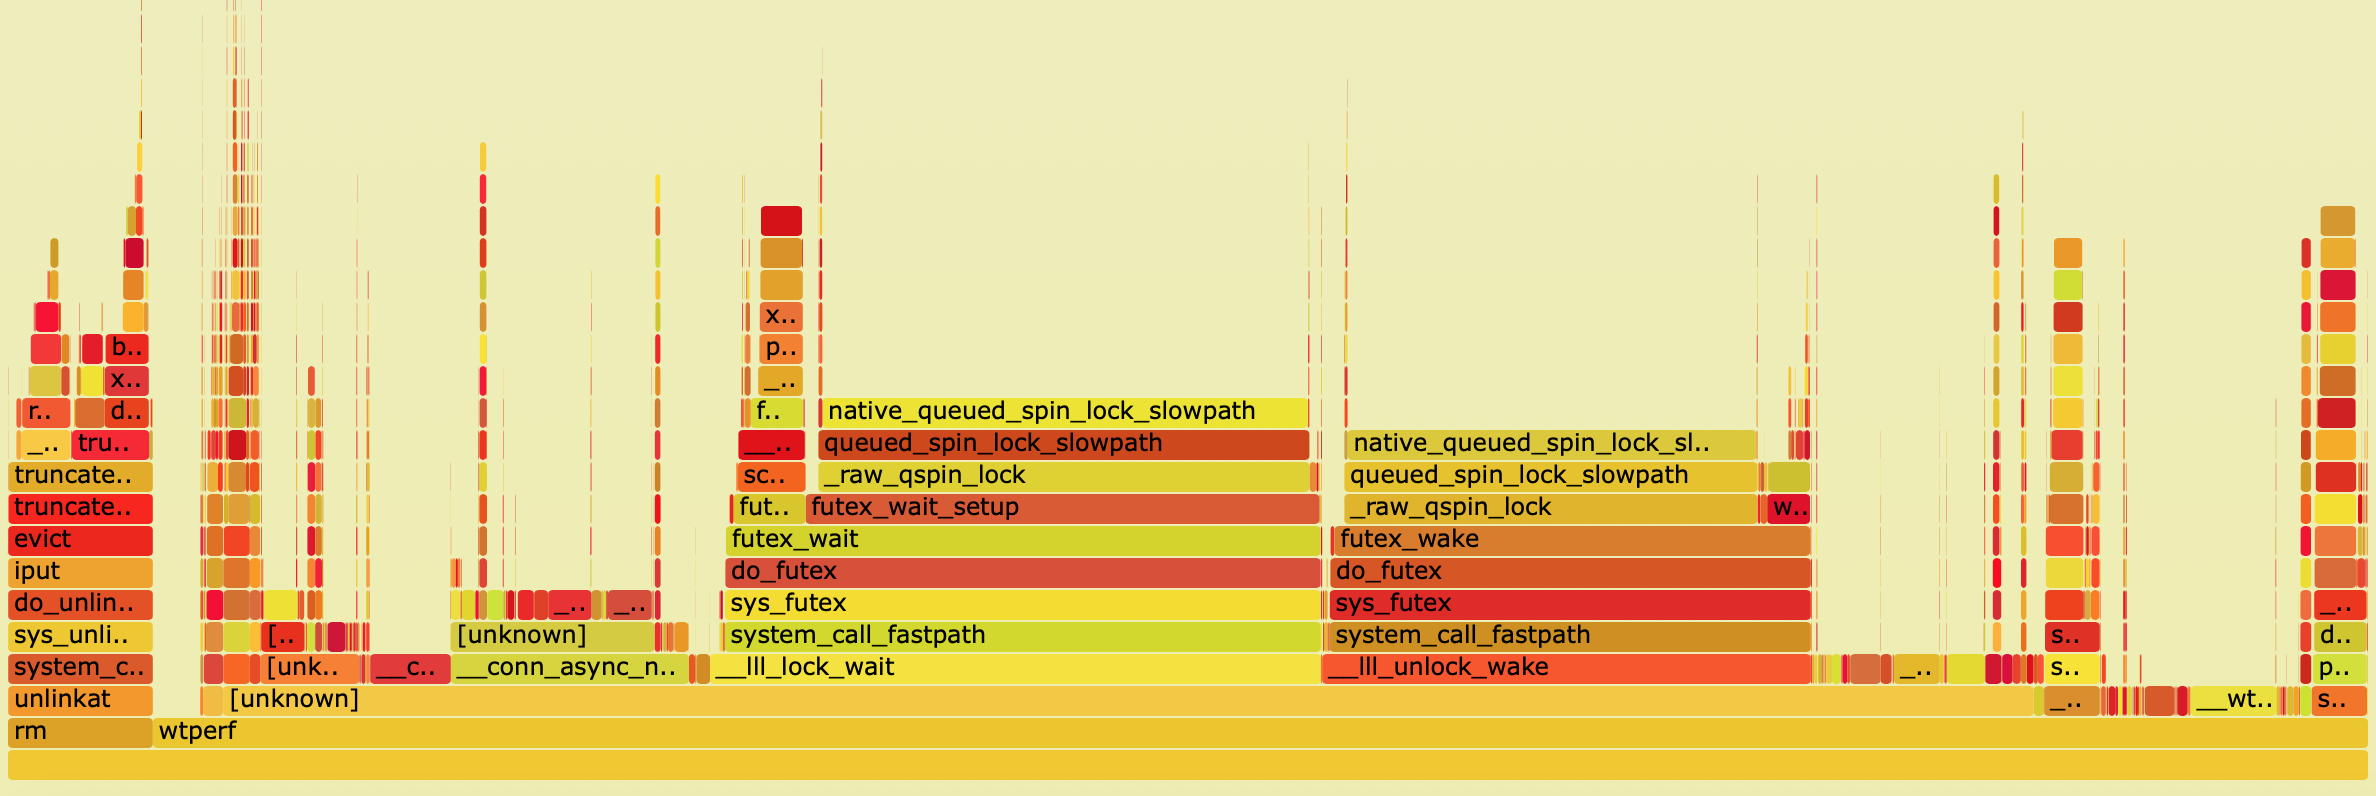
Download the non-redacted interactive version here and open it in your web browser.
If you see 'unknown' call stacks in your FlameGraph, this means that perf could not resolve the symbols. To fix this, install the versions of the libraries or the OS kernel with symbols included, link against those libraries and re-gather the perf output.