 |
Version 10.0.0
|
|
Version 10.0.0
|
The following content describes a subset of the statistics features available in WiredTiger. For more complete information see the statistics page in the WiredTiger documentation. This content focuses on analyzing and reviewing the data generated by the statistics logging functionality.
By default statistics are disabled in WiredTiger - this is because tracking statistics has a performance overhead. WiredTiger has two modes for tracking statistics fast and all. Fast statistics are those that don't incur a significant performance overhead. The effect on performance of enabling statistics varies depending on the database and access characteristics. To enable statistics you should include either statistics=[fast,clear] or statistics=[all,clear] in the configuration string to wiredtiger_open.
Alternatively you can set the WIREDTIGER_CONFIG environment variable to include the relevant configuration string. Note that the environment variable is checked at wiredtiger_open time - changing the environment variable after WiredTiger is already running will not alter the behavior of WiredTiger.
WiredTiger provides two methods for accessing statistics: using a statistics: uri in the WiredTiger WT_CURSOR API and using the built in statistics logging functionality. The remainder of this document assumes the use of the statistics logging functionality as the tools provided parse the output that it generates.
Enabling statistics logging causes WiredTiger to generate files containing statistics information in the database directory. To enable statistics logging include statistics_log=(wait=30) in the configuration string to wiredtiger_open.
The wait option configures how often the statistics are written to the log file in seconds. Gathering and writing statistics has overhead - so this period should not be too small. The default location for statistics log files is in the WiredTiger database directory. The files are named WiredTigerStat.XX, where XX corresponds to the current hour. A new file is created for each hour. If your application runs for more than 24 hours and the file names wrap, the statistics logging output is appended to the already existing files. Statistics log file names are configurable. The output in the statistics log files is textual and human readable.
WiredTiger provides several tools that generate visual representations of statistics based on statistics log files.
D3 is a standard for generating interactive graphs in a HTML page. There is a python program in the WiredTiger source tree at tools/wtstats.py that can be used to generate a D3 html page based on WiredTiger statistics log(s). In order to use the Python script you need to have Python installed and a recent version of the Python nvd3 library.
To install nvd3:
 $ git clone https://github.com/areski/python-nvd3.git
 $ cd python-nvd3/
 $ sudo python setup.py install
It is not sufficient to run pip install python-nvd3 - the version provided by the library is too old.
Once you have the prerequisites installed you can generate a graph that contains your statistics by running:
 $ cd ~/work/wiredtiger
 $ python ./tools/wtstats.py <path/to/db/directory/WiredTigerStat.*>
 $ ls wtstats.html
 wtstats.html
There are several optional arguments. Run with -h or --help to see them. For example, -o file or --output file redirects where the HTML output goes. Also --focus generates a chart that contains a focus slider to allow you to zoom in on particular time periods.
You can open the generated HTML document in your browser, and see the generated statistics. The keys in the graph are clickable - double clicking on one of the keys will show only that statistic. Single clicking will enable/disable a particular statistic.
WiredTiger provides a python application that plots relevant statistics on individual graphs using gnuplot. The following commands will generate graphs of this type:
 $ cd ~/work/wiredtiger
 $ python tools/statlog.py <path/to/db/directory/WiredTigerStat.*>
 $ ls reports
 raw             report.010.png  report.020.png  report.030.png
 report.001.png  report.011.png  report.021.png  report.031.png
 report.002.png  report.012.png  report.022.png  report.032.png
 report.003.png  report.013.png  report.023.png  report.033.png
 report.004.png  report.014.png  report.024.png  report.034.png
 report.005.png  report.015.png  report.025.png  report.035.png
 report.006.png  report.016.png  report.026.png  report.036.png
 report.007.png  report.017.png  report.027.png  report.037.png
 report.008.png  report.018.png  report.028.png  report.038.png
 report.009.png  report.019.png  report.029.png  report.039.png
Each of the images contains a graph for a single statistic over time.
The following steps take you through the process of generating a D3 graph of WiredTiger statistics based on the statistics generated from running an application included in the WiredTiger tree called wtperf. These instructions assume you have all the necessary tools to build WiredTiger, Python and python-nvd3 installed.
 $ echo "First get and build a working WiredTiger install"
 $ cd work
 $ wget http://source.wiredtiger.com/releases/wiredtiger-2.0.1.tar.bz2
 $ tar jxf wiredtiger-2.0.1.tar.bz2 && cd wiredtiger-2.0.1
 $ ./configure && make -j 12
 $ echo "Run an application that will generate statistics"
 $ mkdir WT_TEST && ./bench/wtperf/wtperf \
    -O bench/wtperf/runners/update-lsm.wtperf \
    -o "conn_config=\"cache_size=1G,statistics=[fast,clear],statistics_log=(wait=30)\""
 $ echo "Now generate a graph from the statistics"
 $ python ./tools/wtstats.py WT_TEST/WiredTigerStat.*
The above steps will have generated a file called wtstats.html open this file in a web browser and review the statistics. The page you see should look something like:
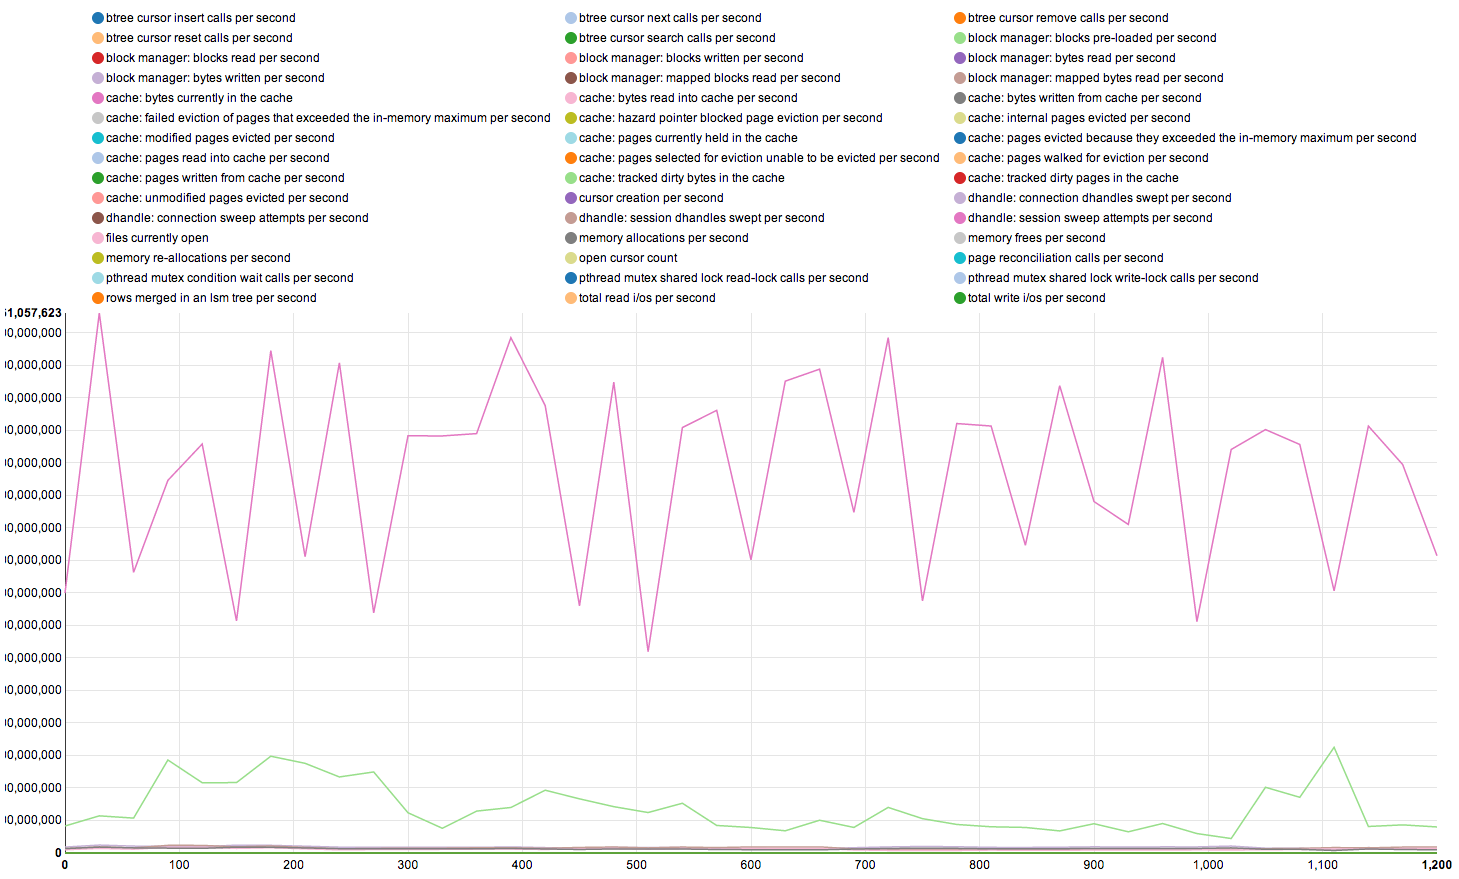
If you double click on the "btree cursor insert calls per second" key, it will show just that statistic in the window. Depending on the test you ran (I ran a modified version of the update-large-lsm.wtperf configuration), the graph may look something like:
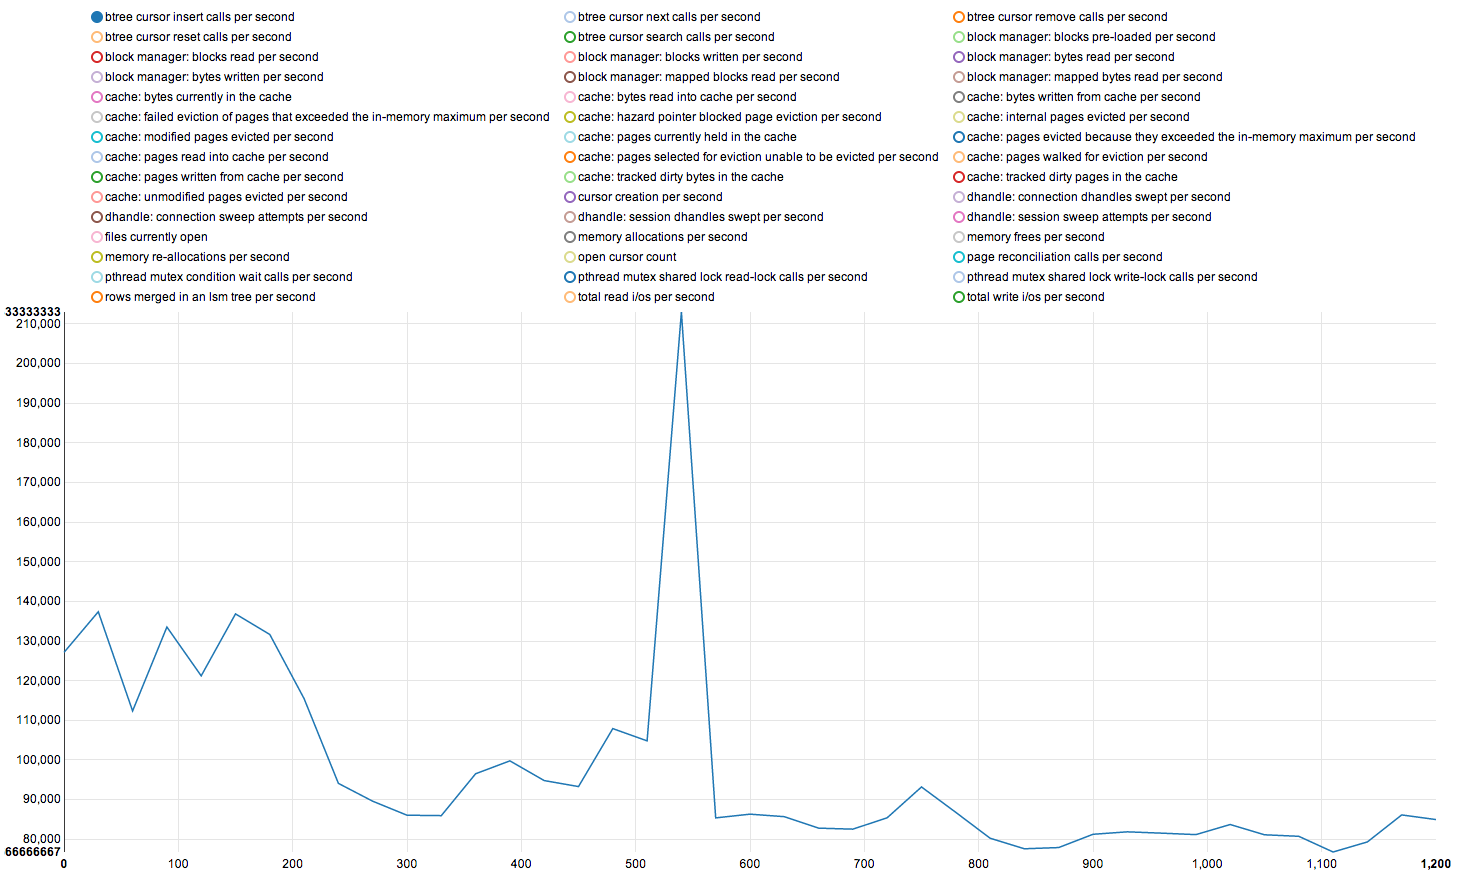
This is an interesting graph. We can do some analysis on the meaning of the results:
From this particular statistic we can gather that it's unlikely the cursor insert rate that is a bottle neck in this particular test - since we could achieve an insert rate over double the steady state insert rate when required.